
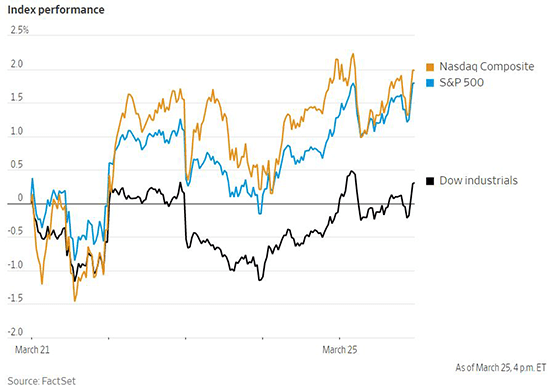
Despite mixed trading on Friday, US stocks held on to a second consecutive week of gains. The S&P 500 rose 1.8% while the Nasdaq Composite climbed 2%, following large gains of 6% and 8%, respectively, from the week prior. The S&P 500 broke through its 200-day moving average to the upside and ended the week at a six-week high. The gains were broad based for all sectors except for healthcare. The energy sector gained nearly 8% for the week as the price of oil bounced back up to $113 per barrel. The materials sector also had a strong showing with a gain of roughly 4% for the week with steelmakers and fertilizer producers leading. The Dow Jones Industrial Average recovered from earlier losses to end the week up by 0.3%. Meanwhile small cap stocks did not participate in the rally enjoyed by large caps. The Russell 2000 fell 0.4% over the course of the week.
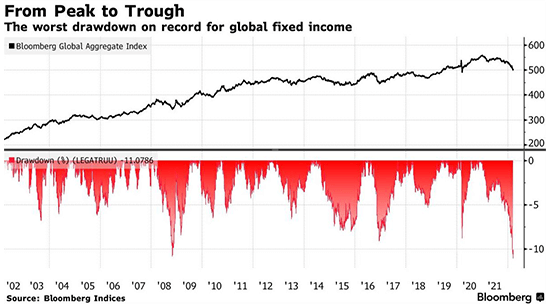
Federal Reserve Chairman Jerome Powell struck a hawkish tone last week when commenting that the Fed would be prepared to hike interest rates by 50 basis points at its next meeting if necessary. Bond investors were quick to price in the more aggressive stance. The yield on the two-year Treasury note has now seen the sharpest quarterly rise since Paul Volcker was Fed Chairman. The Treasury yield curve is threatening to invert as yields on the short end of the curve have risen faster than the long end, but the two-year yield is still below the 10-year yield as 2.29% and 2.49%, respectively. Deutsche Bank currently forecasts that the Fed will begin quantitative tightening in June. They expect the Fed to draw down its balance sheet by $800 billion this year and a further $1.1 trillion next year, which would be roughly equivalent to three to four quarter-percentage-point rate hikes. The Bloomberg Global Aggregate Bond Index has now reached its most severe drawdown dating back to 1990. Since peaking in January 2021, the index has shed 11%, surpassing the 10.8% drawdown witnessed during the financial crisis of 2008.
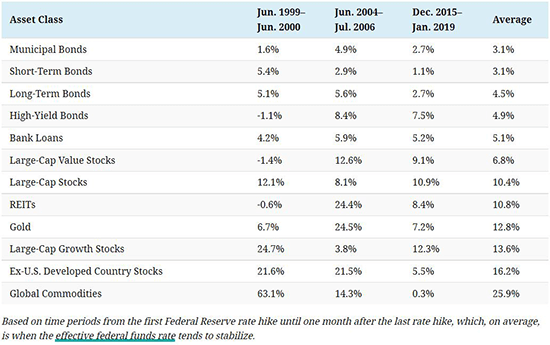
With the US Federal Reserve beginning another cycle of interest rate hikes to combat high inflation, it is useful to review how markets performed in prior cycles. The chart below examines the annualized return of various asset classes over the last three hiking cycles. Among fixed-income instruments, bank loans had the strongest returns on average along with fairly low risk. Though long-term bonds returned an average of 4.5%, they also experienced higher volatility than any other fixed-income class including high yield. Among equities, ex-US developed stocks had the highest returns on average. Diversified domestic US large cap stocks also performed well on average and recorded the lowest risk among the equity asset classes examined. Alternative assets were also generally strong performers with REITS averaging a return of 10.8% and gold returning 12.8%. Commodities had the highest average return, though with a wide divergence between the different time periods and the highest volatility of any asset class.
The representations and opinions herein are the opinions and views of EQIS Capital Management, Inc. ("EQIS"), a registered investment adviser. The information is believed to be reliable but is not guaranteed by EQIS. The information contained herein is for informational and comparison purposes only. The representations and opinions herein are the opinions and views of EQIS. When applicable, sources used in forming EQIS’s opinion are cited, however other sources may be available which contradict EQIS’s opinion, process and methodology. While EQIS believes the data to be reliable, no representation is made as to, and no responsibility, warranty or liability is accepted for the accuracy or completeness of such information. This material represents an assessment of the market environment at a specific time and is not intended to be a forecast of future events or a guarantee of future events. This information should not be relied upon as research or investment advice. EQIS does not provide legal or tax advice.
LF1620