
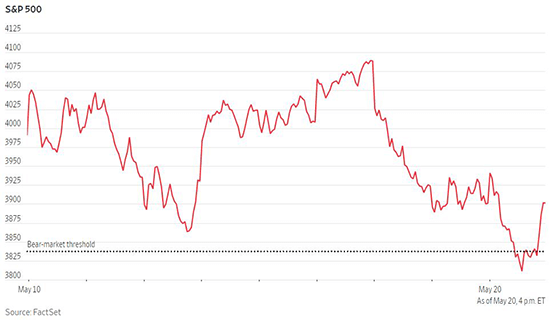
Stocks continued to sell off last week with the S&P 500 falling more than 20% below its prior high at one point before a late rally trimmed the drawdown to 19%. The Dow Jones Industrial Average has now fallen for eight straight weeks, its longest streak of losses since 1932. The Nasdaq Composite and S&P 500 are both currently in their longest streaks of weekly losses since 2001. The selling pressure that was initially focused on the technology sector has broadened to the rest of the economy as investors reassess the outlook for global economic growth. Though most economists still expect the US economy to continue growing this year, concerns are growing for next year. Economists at Goldman Sachs are now forecasting a 35% chance of a recession over the next 24 months while the Moody’s Analytics chief economist put the odds of a US recession in the next 2 years at roughly 50/50. While expectations for higher interest rates recently pushed the yield on the 10-year US Treasury note above 3%, a renewed flight to safety saw the yield drop all the way back down to 2.785% on Friday.
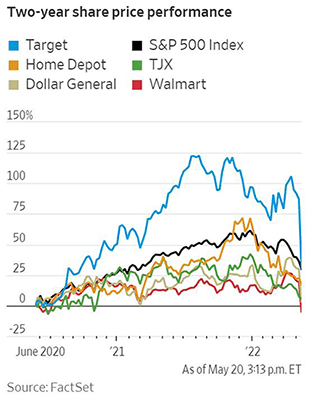
Major US retailers including Target and Walmart reported first-quarter earnings last week, giving analysts updated information on how consumer discretionary and consumer staples companies are weathering inflation. The earnings results broadly fell short of forecasts. Top line sales rose for both retail chains in nominal terms as retailers have been steadily raising prices. However, rising costs for goods, transport and labor outpaced the price increases and weighed on profit margins. The disruptions in supply chains have meant that goods such as clothes and home furnishings that were in demand months ago are finally arriving, but consumers are increasingly shifting spending to essentials and services instead. This has resulted in increased inventories, which may force retailers to sell more goods at a discount down the road. Walmart’s share price fell by 11% after reporting earnings, its second largest daily drop on record. Target had performed well during the pandemic with a larger online presence but its shares dropped 25% after reporting first quarter earnings. Thankfully, consumer spending overall remains strong, and rose 0.9% in April compared to the month prior. This is the fourth straight month of increasing retail sales, though it is important to note that those figures are not adjusted for inflation.
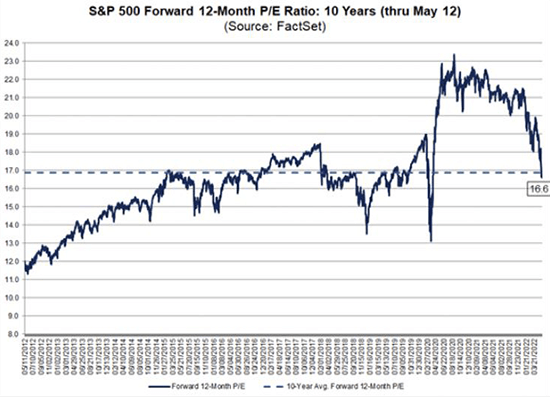
The selloff in the S&P 500 this year has resulted in its forward 12-month price-to-earnings ratio falling to 16.6 as of May 12. That is a lower P/E ratio than its five-year average of 18.6 and its 10-year average of 16.9. However, the S&P 500 is still more expensive than its 15-year, 20-year and 25-year averages. It also remains well above the lowest level in the past nine years of 13.1, which occurred on March 23, 2020. At its recent peak on January 3, 2022, the P/E ratio stood at the expensive multiple of 21.4. Notably, 12-month forward earnings per share estimates have risen by 6.1% so far this year, so the decrease in the multiple is entirely due to the 17.5% decrease in the price of the S&P 500 through May 12. The fall in the P/E ratio this year puts its valuation much more in line with what is typical in the historical data. Decomposing P/E ratios on a sector basis shows that five sectors have forward P/E ratios below their 10-year averages, with energy and materials trading at the steepest discounts. Five sectors currently trade above their 10-year average, with utilities and consumer staples reflecting the highest premium to their average. The healthcare sector currently trades exactly in line with its 10-year average at 15.6.
The representations and opinions herein are the opinions and views of EQIS Capital Management, Inc. ("EQIS"), a registered investment adviser. The information is believed to be reliable but is not guaranteed by EQIS. The information contained herein is for informational and comparison purposes only. The representations and opinions herein are the opinions and views of EQIS. When applicable, sources used in forming EQIS’s opinion are cited, however other sources may be available which contradict EQIS’s opinion, process and methodology. While EQIS believes the data to be reliable, no representation is made as to, and no responsibility, warranty or liability is accepted for the accuracy or completeness of such information. This material represents an assessment of the market environment at a specific time and is not intended to be a forecast of future events or a guarantee of future events. This information should not be relied upon as research or investment advice. EQIS does not provide legal or tax advice.
LF1752