
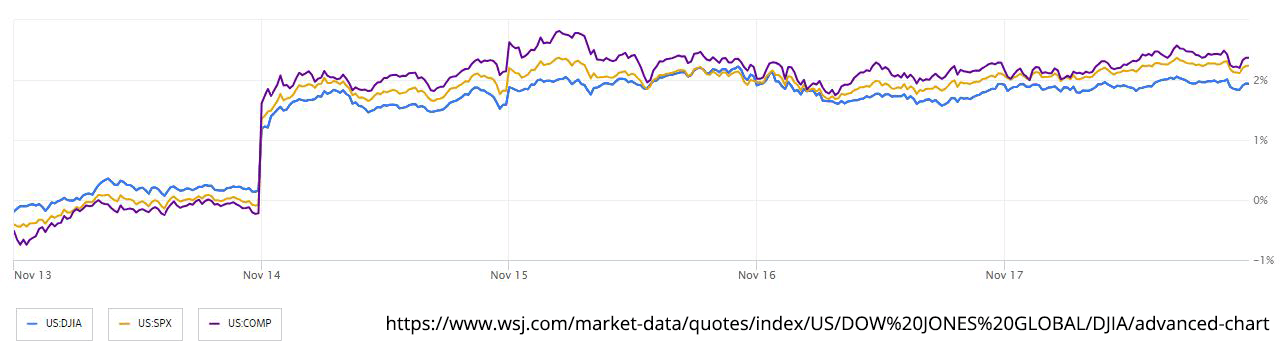
U.S. stocks experienced minor fluctuations to end the week following a $2.7 trillion rally fueled by expectations that the Federal Reserve would cease its hiking cycle to avert a recession. The S&P 500 surpassed 4,500, marking its third consecutive week of gains, the longest run since July. Despite concerns of overbought conditions, global stock funds attracted the second-largest inflows of the year, reaching $23.5 billion for the week ending November 15, as per Bank of America Corp. The U.S. dollar erased its 2023 gains in its worst week in four months, reflecting market sentiments that the currency has peaked. Soft economic data supported the belief that the Fed had concluded its rate hikes, contributing to the dollar's decline. Ten-year U.S. yields remained relatively stable, while oil marked its fourth consecutive weekly drop due to supply pressures. In the bond market, the Bloomberg U.S. Aggregate index posted a 1.2% gain for the week through Thursday, bringing the year-to-date increase to 0.4%.
Federal Reserve officials provided mixed signals. Fed Vice Chair for Supervision Michael Barr suggested that the tightening cycle might be near its end, while Fed Bank of San Francisco President Mary Daly expressed uncertainty about inflation reaching the 2% target. Analysts noted that investors might be prematurely anticipating rate cuts, with expectations of a possible rate reduction by the Fed in May 2024. Bloomberg Intelligence found that valuations of high-quality stocks, characterized by high profitability and low leverage, have become notably more expensive compared to the broader market and lower-quality counterparts. This pattern has historically occurred during turbulent periods, such as in 2020 and 2008-2009, leading investors to seek safety in high-quality investments. As earnings season concludes, the S&P 500 is emerging from a profit recession, with earnings up 4% year-over-year with over 90% of S&P 500 firms having reported results for the third quarter.
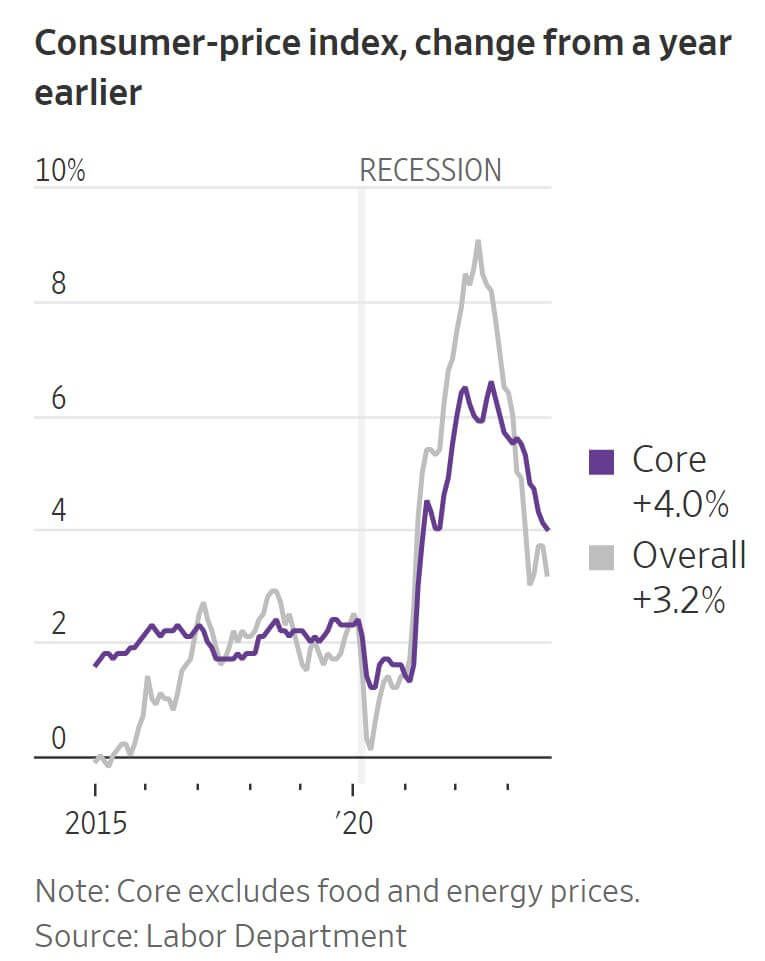
In October, consumer prices showed a slower year-over-year increase of 3.2%. The core inflation rate, excluding volatile food and energy items, also indicated a deceleration, standing at an annual rate of 2.8% for the five months ending in October, down from 5.1% in the first five months of the year. Several factors contributed to this easing, including lower prices for cars and airfares, as well as milder growth in housing and other services. Analysts view core inflation as a better predictor of future trends, and its consistent decrease over the past five months suggests a positive trajectory. Simultaneously, the producer price index experienced an unexpected 0.5% fall compared to the prior month, primarily attributed to a substantial drop in gasoline costs, marking the most significant decrease since April 2020. The Labor Department's Producer Price Index (PPI) indicated a 1.3% increase in overall wholesale prices from a year ago, with the core gauge showing the smallest annual increase since the beginning of 2021.
US shoppers exhibited moderation in spending in October following a robust summer, aligning with the Federal Reserve's desire for a gradual economic cooldown. Retail receipts declined by 0.1%, a figure lower than anticipated, with upward revisions in sales for the preceding two months. Bill Adams, Chief Economist at Comerica Bank, forecasts continued but modest consumer spending growth in 2024, with the economy potentially returning to a more normal rate of inflation and growth without slipping into a recession. Strong consumer spending has been a key factor in economic resilience, but there are forecasts of a pullback as the impact of rate increases continues to affect jobs and wage growth. Kathy Bostjancic, Chief Economist at Nationwide Mutual Insurance Co., highlighted the alignment of these trends with the Federal Reserve's monetary policy, suggesting a reduction in inflationary pressures.
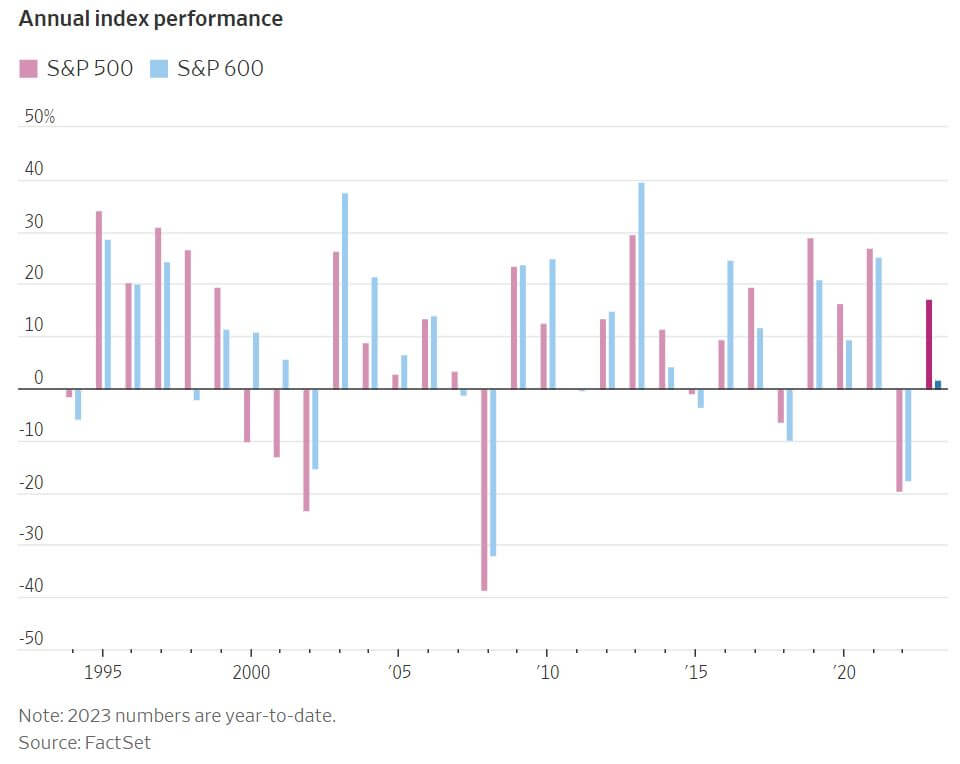
The S&P 600, an index comprised of smaller companies, has experienced a robust autumn stock-market rally, gaining 8% since October 27, albeit slightly trailing the S&P 500. However, YTD the S&P 600 lags significantly behind its large-cap counterpart by the widest margin since 1998. Smaller companies, reliant on speculative financing, have been disproportionately affected by the Federal Reserve's interest-rate strategy. The core issue lies in the prevalence of floating-rate debt among small-caps, with approximately 40% of S&P 600 companies having such debt compared to only 10% in the S&P 500. This distinction exposes smaller companies to higher interest expenses that dent their bottom lines. In contrast, larger companies, having predominantly opted for fixed-rate debt in 2020 and 2021, are more insulated from interest rate fluctuations.
Investors are advised to exercise caution, particularly with small-caps exhibiting high financial and operational leverage, as their widespread unprofitability and inclination toward junk-rated debt pose risks. The recent rally in small-caps has been fueled by expectations that the Federal Reserve has completed its interest rate hikes, a sentiment reinforced by a cooler-than-expected inflation report for October. If the Fed achieves a soft landing without inducing a prolonged recession, small-caps could continue to rally, given their close correlation with economic health and reliance on domestic sales. Despite the recent rally, small-caps appear historically inexpensive, with the S&P 600 trading at 12.7 times projected earnings for the next 12 months, up from 11.2 times in October but still below its five-year average of 14.5. In comparison, the S&P 500 carries a higher multiple of 18.7, suggesting potential opportunities in the small-cap sector if the interest rate environment becomes more favorable.