
The U.S. stock market reached new highs after jobs data fueled expectations of a Federal Reserve rate cut in December. The labor market data showed increased hiring and a slight rise in unemployment, suggesting moderation rather than significant deterioration. Strategists described the jobs data as a "Goldilocks" scenario, supporting gradual Fed easing into 2025. However, recent inflation signals suggest challenges ahead, with core inflation projected to remain sticky. Fed officials signaled caution, with rate adjustments likely to slow if inflation doesn't decelerate. Analysts viewed the report as reassuring for investors, supporting expectations for a December rate cut, though pending inflation data remains crucial. Shorter-dated Treasuries outperformed as swap traders assigned an 80% probability to a quarter-point rate reduction.
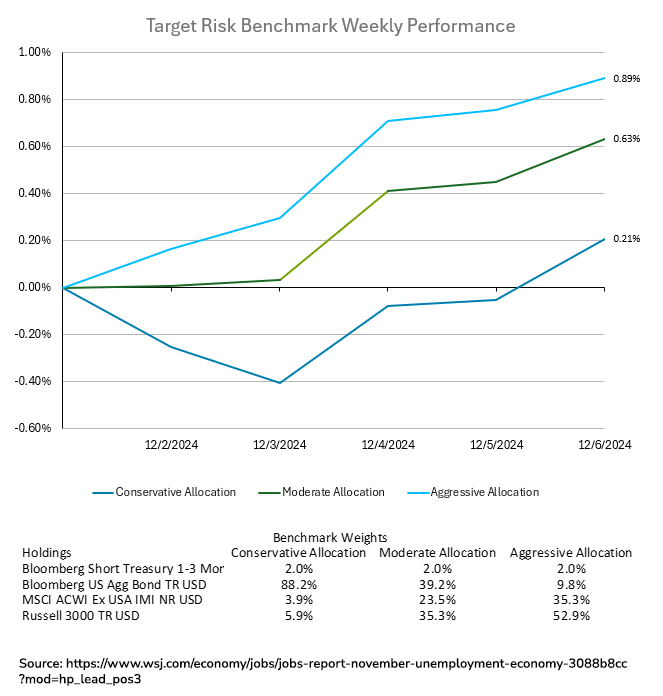
The S&P 500 recorded its 57th closing high of 2024, with a nearly 30% gain YTD, marking its best performance since 2019. Major tech stocks like Meta and Alphabet rose on news of a potential TikTok ban, while Nvidia and Qualcomm declined amid Apple’s planned modem rollout. Treasury yields edged lower, while the Bloomberg Dollar Spot Index gained 0.2%. Strong economic growth, a healthy labor market, and contained inflation have bolstered optimism for continued market gains. HSBC forecasted the S&P 500 to reach 6,700 in 2025, though Bank of America warned of potential overvaluation risks. Overall, analysts expect broad profit growth and steady conditions to sustain the bull market. Equities fared better than bonds for the week, benefiting investors with higher risk tolerances. The aggressive target risk benchmark gained 0.89% for the week, while the moderate target risk benchmark was not far behind with a weekly gain of 0.63%. The conservative target risk benchmark bounced back from losses earlier in the week to finish the week in the green with a small gain of 0.21%.
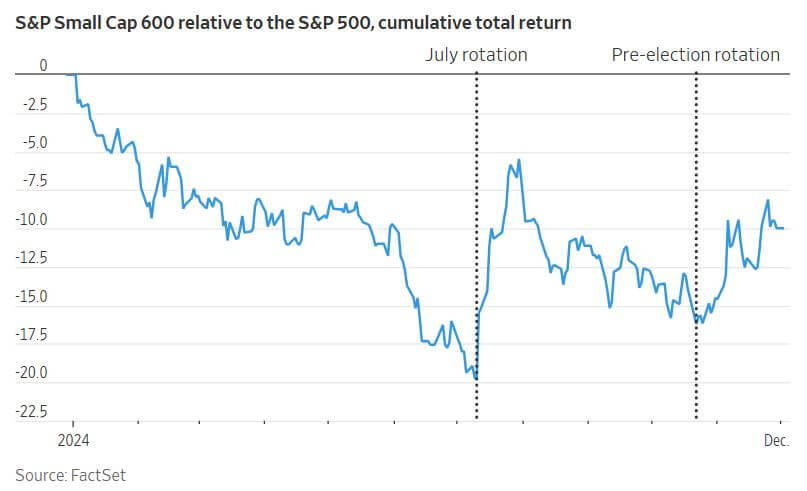
Small-cap stocks have gained prominence as part of the recent “Trump trade,” outperforming the S&P 500 since the November 5 election, with the S&P SmallCap 600 Index rising nearly 8%. This resurgence is fueled by expectations for Republican policies favoring domestic businesses, including lower taxes and lighter regulations. Additionally, the Fed’s interest rate cuts position small-caps favorably in monetary-easing cycles, historically boosting their returns during such periods. Despite their recent performance, small-cap stocks have significantly lagged large-caps over the last several years. Since 2019, they trail the S&P 500 by nearly 40 percentage points. However, valuation gaps present a compelling case for investment. Small-caps trade at 18 times trailing earnings compared to the S&P 500’s 28 times, with historical data indicating that such gaps have led to outperformance in 96% of similar scenarios over five-year periods. Over rolling 10-year periods, high-profitability small-caps have delivered average annualized returns of 14%, outperforming similarly profitable large-caps, which had a return of 12%. This advantage is attributed to the “size effect,” a phenomenon where smaller companies generally deliver better risk-adjusted returns, identified in academic research since 1981. Active fund managers also find opportunities in this space, as avoiding unprofitable small-caps—common in indexes like the Russell 2000—enhances returns. Profitability-focused indexes, such as the S&P 600, further strengthen small-caps’ appeal. While concerns about declining high-quality small-cap companies persist, the long-term data underscores their viability as a core portfolio component. Historically, small-caps have excelled regardless of timing, offering investors both diversification and the potential for appreciation.
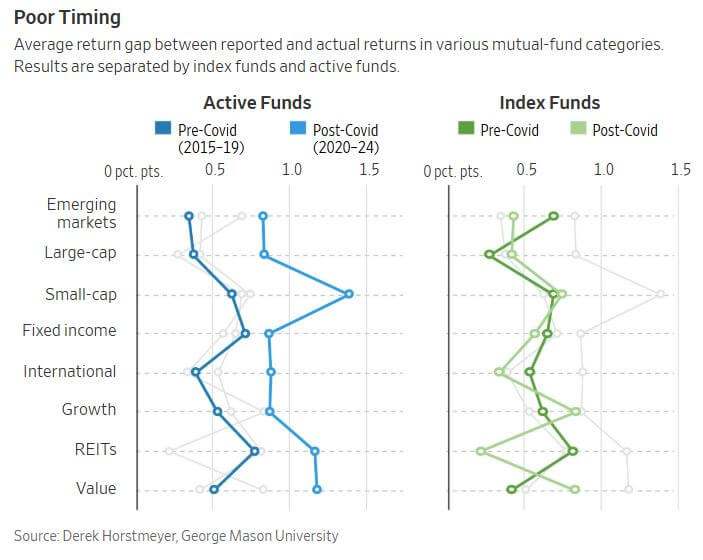
The Covid-19 pandemic disrupted individual investor behavior, leading to a significant increase in detrimental trading practices. From 2020 to 2024, investors exhibited heightened tendencies to attempt to time market tops and bottoms, resulting in nearly double the average annual portfolio losses compared to the pre-Covid period. Research by the Wall Street Journal analyzing U.S. mutual fund returns reveals that poor market timing cost investors in actively managed funds an average of 1.01 percentage points annually post-Covid, up from 0.53 points pre-Covid (2015–2019). This effect was most pronounced in U.S. small-cap funds, where the average annual return gap—representing the difference between stated fund returns and actual investor returns—jumped from 0.62 to 1.38 percentage points post-Covid. Similar inefficiencies were observed in other actively traded categories, such as large-cap funds, though the impact was slightly less severe. The trend was less pronounced in index funds, where only four out of eight categories (large-cap, small-cap, value, and growth) showed marginally higher return gaps. These findings underscore the unique risks associated with active fund trading during volatile periods. The study attributes these inefficiencies partly to investor behavior during the pandemic. Homebound individuals, influenced by resources promoting active trading and internet forums like Reddit’s WallStreetBets, engaged in frequent, poorly timed trades during volatile market conditions. This "trigger-happy" approach persisted even as the pandemic's public health threat diminished. The findings reaffirm a long-held investment principle: most investors benefit more from staying invested rather than attempting to time the market. By pulling funds during market lows and investing during highs, many missed out on returns that could have offset fund fees or enhanced portfolio performance. The pandemic-era trading frenzy serves as a cautionary tale for the perils of reactive, short-term investment strategies.